Degree Days
Source: U.S. Energy Information Administration.
Where can people find degree-day data?
Historical monthly (from 1973) and annual (from 1949) population-weighted degree-day data for the United States and U.S. census divisions are available in Table 1.11 and Table 1.12 of the Monthly Energy Review.
Historical monthly and annual population-weighted degree days for U.S. census divisions for 20 years and a forecast for one to one-and-a-half years are available in the Short-Term Energy Outlook (STEO) Data Browser.
A comparison of short-term changes in Degree Days (since 2014) for the weather station of your choice is available at Weather Data Depot.
What do people use degree day data for?
People study degree-day patterns to assess the climate and to assess the heating and cooling needs for different regions of the country. Collectively, heating and cooling the spaces in which we live accounts for 51 percent of the energy that American households use every year. Heating and cooling degree days suggest how temperature changes affect energy demand, but they do not necessarily reflect actual energy use. Many other factors have influenced energy demand over time, such as more energy-efficient heating systems, the introduction and increasingly widespread use of cooling technologies, larger but better-insulated homes, behavior change, and population shifts (such as more people moving to warmer regions).
What are population-weighted degree days?
Degree days can be weighted according to the population of a region to estimate energy consumption. The U.S. Energy Information Administration (EIA) uses population-weighted degree days to model and forecast energy consumption for the United States and for U.S. census divisions.
What is a degree day?
Degree days are measures of how cold or warm a location is. A degree day compares the mean (the average of the high and low) outdoor temperatures recorded for a location to a standard temperature, usually 65° Fahrenheit (F) in the United States. The more extreme the outside temperature, the higher the number of degree days. A high number of degree days generally results in higher energy use for space heating or cooling.
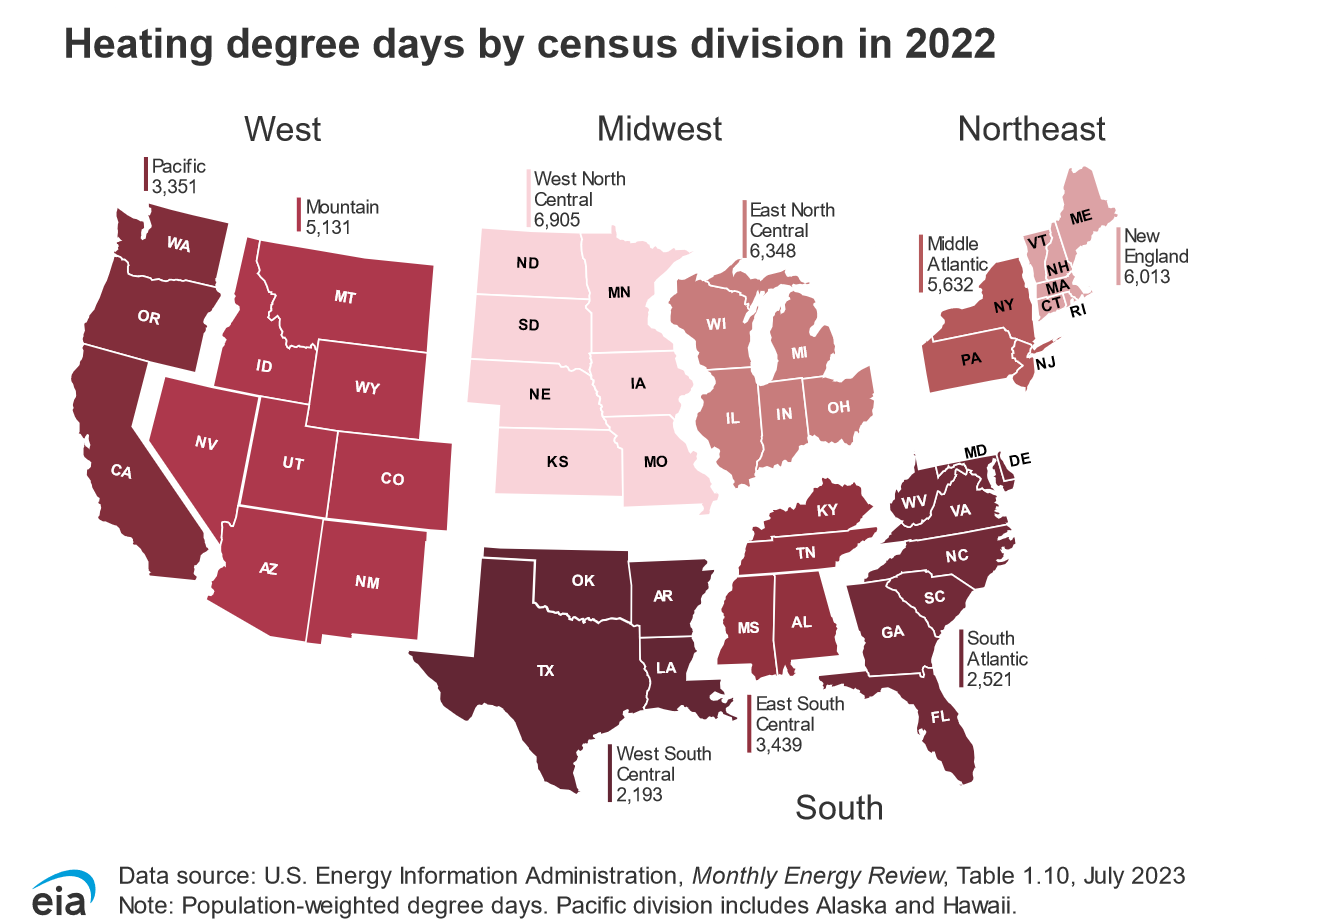
Heating Degree Days (HDDs)
Heating degree days (HDDs) are a measure of how cold the temperature was on a given day or during a period of days. For example, a day with a mean temperature of 40°F has 25 HDDs. Two such cold days in a row have 50 HDDs for the two-day period.The West North Central division had the largest number of heating degree days in 2022.
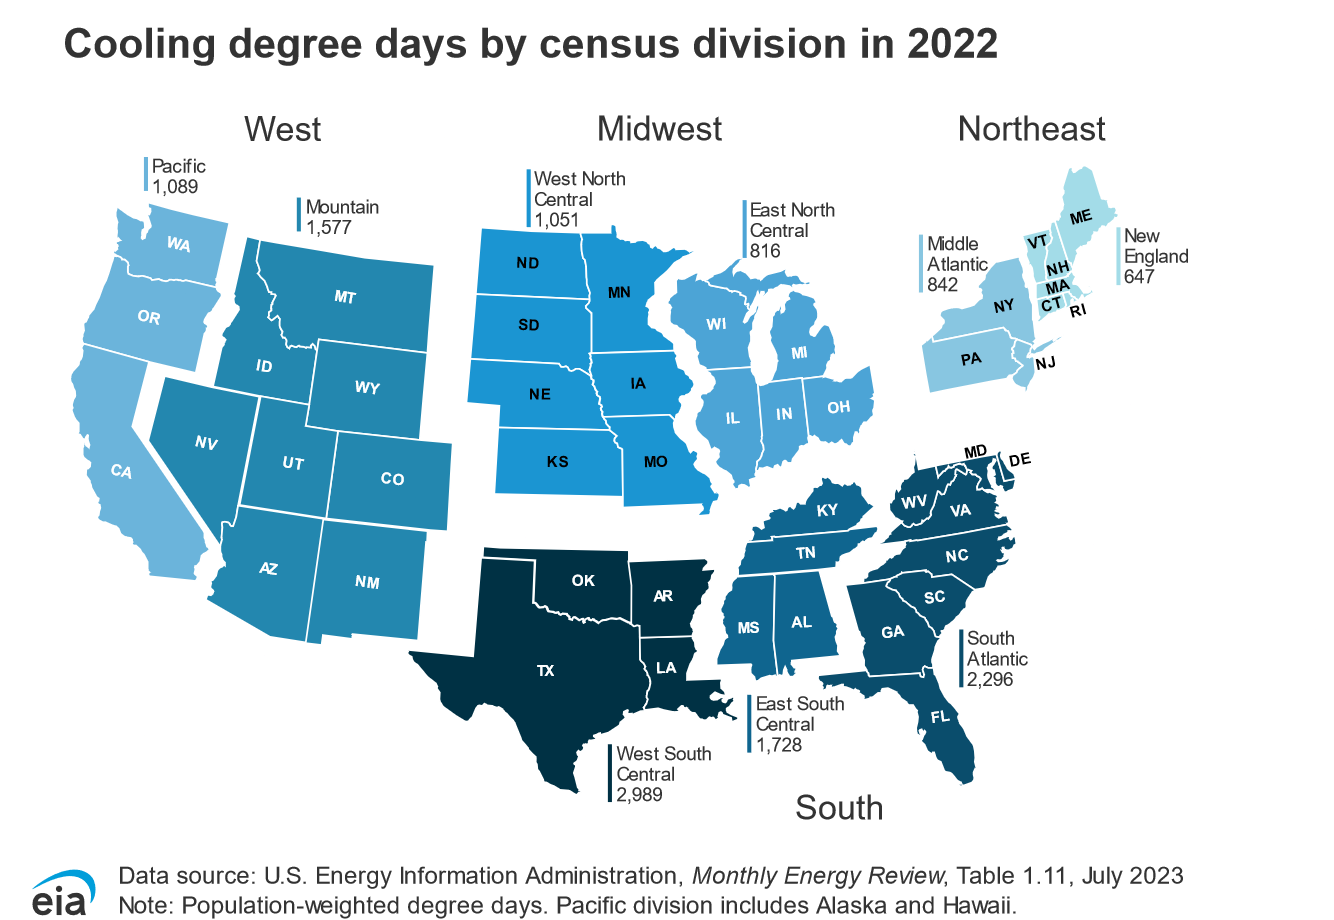
Cooling Degree Days (CDDs)
Cooling degree days (CDDs) are a measure of how hot the temperature was on a given day or during a period of days. A day with a mean temperature of 80°F has 15 CDDs. If the next day has a mean temperature of 83°F, it has 18 CDDs. The total CDDs for the two days is 33 CDDs. The West South Central division had the largest number of cooling degree days in 2022.
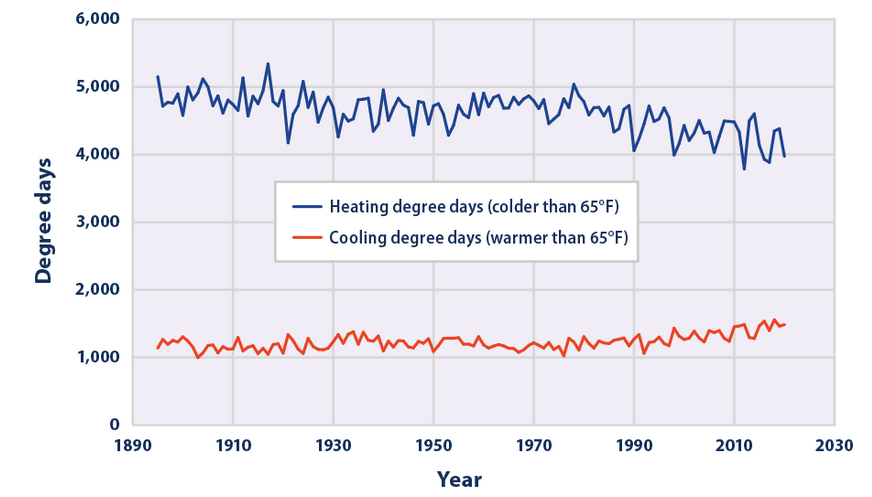
Long-Term Degree Day Trend
Source: U.S. Environmental Protection Agency.
Heating degree days have declined in the contiguous United States, particularly in recent years, as the climate has warmed. Conversly, cooling degree days have increased over the past 100 years.