


Monsoon Rainfall in New Mexico

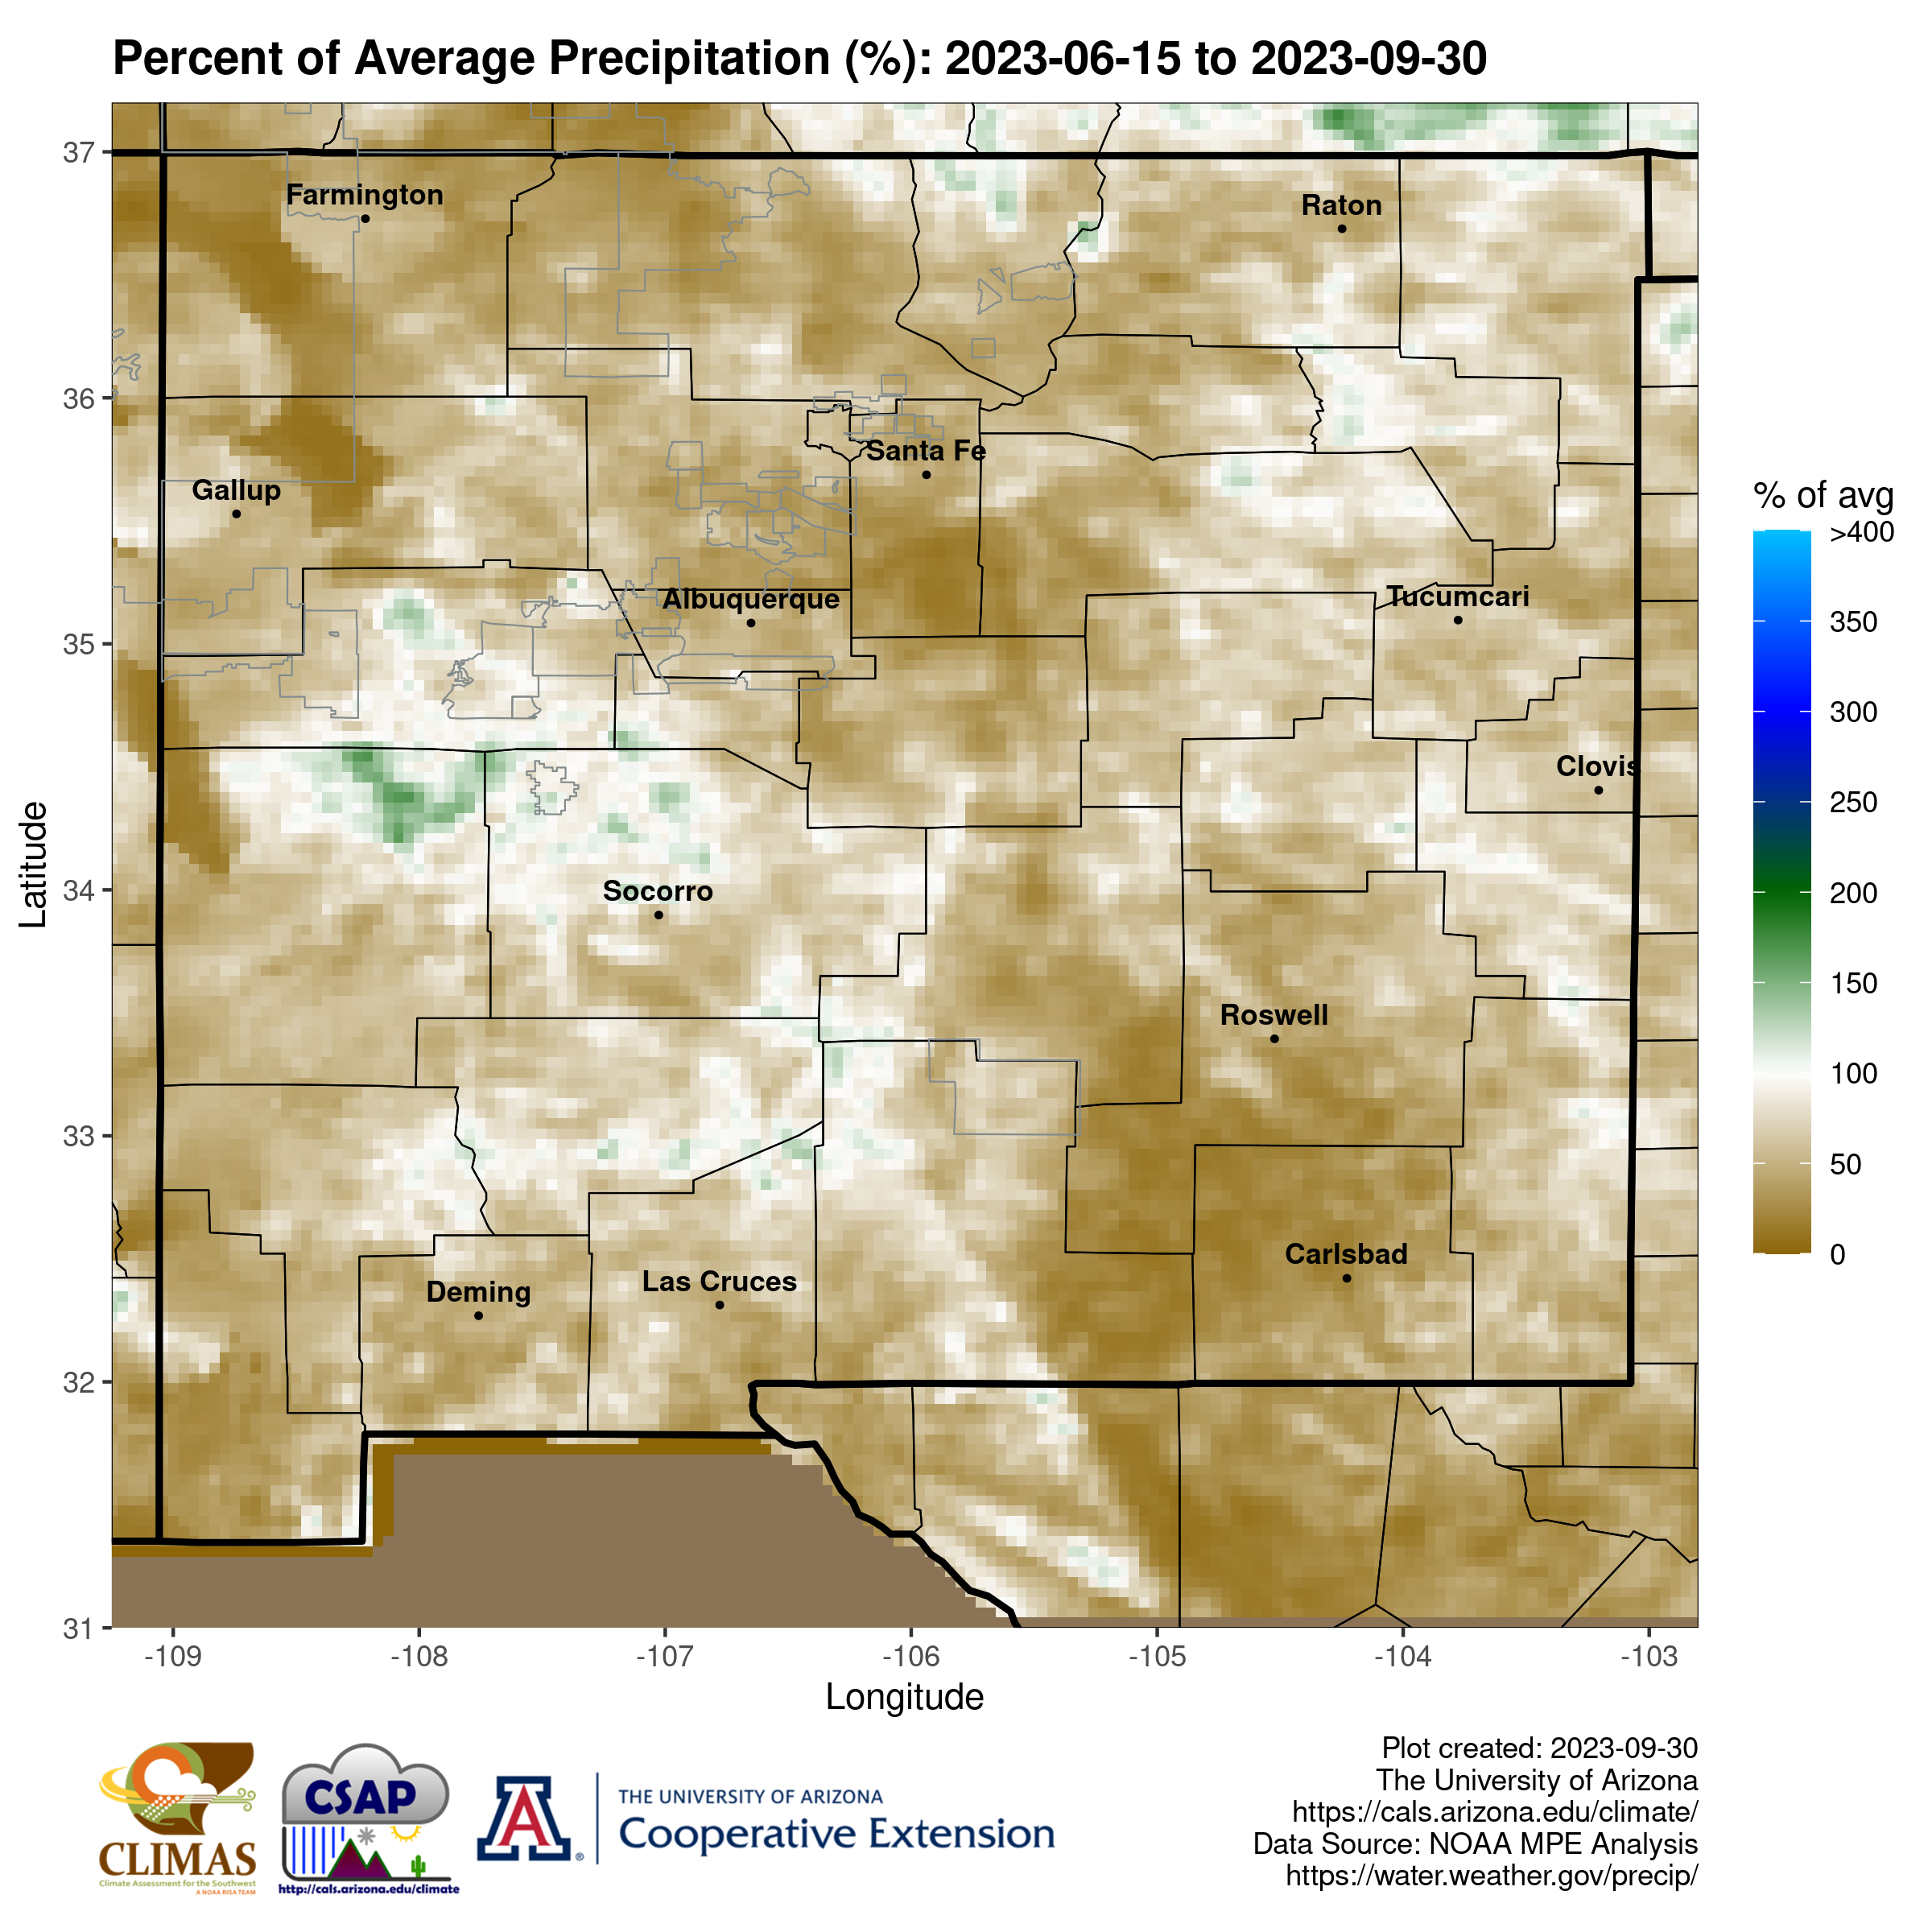
The map below is produced from June 15 to September 30 showing the accumulated rainfall from June 15 as a percent of average. Percent of average is calculated by dividing the total accumulated precipitation by the long-term (1991-2020) mean and is an indication of how much totals have deviated from average precipitation for the June 15th to present period. 100% is equal to average for the time period shown on the map.
The following statistics have been compiled for select locations across northern and central New Mexico to show how variable the North American Monsoon (NAM) is from year-to-year and from location-to-location. Table 1 highlights monsoon precipitation extremes including the wettest and driest monsoon seasons, the wettest day, the longest stretch of days with measurable precipitation (>=0.01,), the average precipitation for the climate period 1981-2010, and the period of record for each location.
